The art of benchmarking and profiling
Published on May 7, 2025
Every developer aspires to create efficient software—at least, we should strive for it. The first step toward optimization is analyzing how our code behaves under significant load. Next comes the detective work: identifying bottlenecks in our implementation or the constraints of our runtime environment (language design, runtime characteristics, and architectural limitations). Armed with these insights, we can strategically refactor our code or, when constrained by environmental factors, address those underlying issues.
These two critical steps translate into benchmarking and profiling, respectively. In this post, I’ll share practical insights about both techniques in the context of Go.
Here’s our game plan: I’ll implement a Trie data structure with Insert and Search operations, then leverage Go’s powerful built-in tools to benchmark, profile, and optimize the implementation as thoroughly as possible.
Understanding the Trie Data Structure
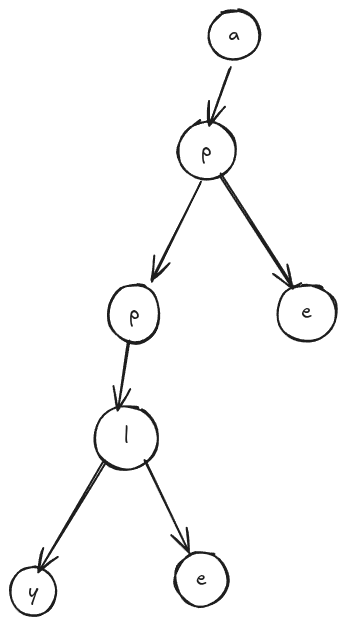
A trie is a tree-based data structure designed to store strings efficiently, making partial and complete lookups lightning-fast. Think of it as a branching path where each node represents a character, and complete words emerge as you traverse from root to leaf.
Here’s a visual example of a trie storing three words: “ape,” “apply,” and “apple.”
Implementation Details
For our implementation, each node can branch into multiple children, which we’ll store in a map where each key represents a character (rune) mapped to another node. We’re constraining our character set to alphanumeric values (0-9 and a-z), giving us a maximum of 36 possible children per node. This constraint keeps our implementation focused while demonstrating the core concepts effectively.
package triemap

import (
	"fmt"
	"strings"
)

type TrieMapNode struct {
	word     bool
	children map[rune]*TrieMapNode
}

func NewTrieMapNode() *TrieMapNode {
	return &TrieMapNode{
		word:     false,
		children: make(map[rune]*TrieMapNode, 36),
	}
}

type TrieMap struct {
	root *TrieMapNode
}

func NewTrieMap() *TrieMap {
	return &TrieMap{
		root: NewTrieMapNode(),
	}
}

func isUnsupportedChar(charInt int) bool {
	return (charInt > 57 && charInt < 97) || charInt > 122 || charInt < 48
}

func (t *TrieMap) Insert(word string) error {
	word = strings.ToLower(word)
	curr := t.root

	for idx, char := range word {
		charInt := int(char)

		if isUnsupportedChar(charInt) {
			return fmt.Errorf("unsupported character %c", char)
		}

		if _, ok := curr.children[char]; !ok {
			curr.children[char] = NewTrieMapNode()
		}

		if idx == len(word)-1 {
			curr.children[char].word = true
		}
		curr = curr.children[char]
	}

	return nil
}

func (t *TrieMap) Search(word string) bool {
	word = strings.ToLower(word)
	curr := t.root

	for _, char := range word {
		charInt := int(char)
		if isUnsupportedChar(charInt) {
			return false
		}

		if _, ok := curr.children[char]; !ok {
			return false
		}

		curr = curr.children[char]
	}

	return curr.word
}
Performance Characteristics
While maps typically offer O(1) constant-time lookups, our trie operates with O(n) complexity, where n represents the number of characters in the word we’re searching for. This might seem counterintuitive at first—shouldn’t we leverage the map’s constant-time advantage? The key insight is that we’re trading individual lookup efficiency for overall storage efficiency and prefix-matching capabilities.
Now comes the interesting question: can we optimize this further? Let’s establish our baseline performance with some benchmarks.
Setting Up Benchmarks
Here’s our benchmark implementation to test both insertion and search operations:
package triemap_test

import (
	"math/rand"
	"strings"
	"testing"
	"time"

	rand2 "math/rand/v2"

	"github.com/stretchr/testify/assert"
	triemap "github.com/zero-shubham/data-structures/Trie/trie_map"
)

func randRange(min, max int) int {
	return rand2.IntN(max-min) + min
}

const letterBytes = "abcdefghijklmnopqrstuvwxyz0123456789"
const (
	letterIdxBits = 6                    // 6 bits to represent a letter index
	letterIdxMask = 1<<letterIdxBits - 1 // All 1-bits, as many as letterIdxBits
	letterIdxMax  = 63 / letterIdxBits   // # of letter indices fitting in 63 bits
)

var src = rand.NewSource(time.Now().UnixNano())

func RandStringBytesMaskImprSrcSB(n int, sb *strings.Builder) string {
	sb.Grow(n)
	// A src.Int63() generates 63 random bits, enough for letterIdxMax characters!
	for i, cache, remain := n-1, src.Int63(), letterIdxMax; i >= 0; {
		if remain == 0 {
			cache, remain = src.Int63(), letterIdxMax
		}
		if idx := int(cache & letterIdxMask); idx < len(letterBytes) {
			sb.WriteByte(letterBytes[idx])
			i--
		}
		cache >>= letterIdxBits
		remain--
	}

	return sb.String()
}

func BenchmarkTrieReuseOverload(b *testing.B) {
	tm := triemap.NewTrieMap()

	b.Run("benchmark insert triemap", func(b *testing.B) {
		sb := strings.Builder{}
		for i := 0; i < b.N; i++ {
			randStr := RandStringBytesMaskImprSrcSB(randRange(5, 500), &sb)

			err := tm.Insert(randStr)
			if err != nil {
				b.Logf("generated string: %s", randStr)
			}
			assert.NoError(b, err)
			sb.Reset()
		}
	})

	randStrsTrie := make([]string, 0, 5000)
	sb := strings.Builder{}
	for i := 0; i < 5000; i++ {
		randStrsTrie = append(randStrsTrie, RandStringBytesMaskImprSrcSB(randRange(50, 500), &sb))
		tm.Insert(randStrsTrie[i])
		sb.Reset()
	}

	b.Run("benchmark search triemap", func(b *testing.B) {
		for i := range b.N {
			ok := tm.Search(randStrsTrie[i%len(randStrsTrie)])
			if !ok {
				b.Log("failed seach for: ", randStrsTrie[i])
			}
			assert.True(b, ok)
		}
	})
}
Our approach is straightforward: insert random strings of length 5 to 500 characters b.N times, then insert 5,000 additional strings of length 50 to 500 characters (without benchmarking these insertions) while keeping track of them for search benchmarking.
Run the benchmark with the following command:
go test -bench=. -benchtime=5s -benchmem -cpuprofile=cpu.out -memprofile=mem.out -trace=trace.outInitial Results
Our first benchmark run yields these results:
goos: linux
goarch: amd64
pkg: github.com/zero-shubham/data-structures/Trie/trie_map
cpu: AMD Ryzen 7 5800HS with Radeon Graphics
BenchmarkTrieReuseOverload/benchmark_insert_triemap-16         	   35383	    560433 ns/op	  271014 B/op	     747 allocs/op
BenchmarkTrieReuseOverload/benchmark_search_triemap-16         	   97314	     52240 ns/op	       0 B/op	       0 allocs/op
PASS
Let’s interpret these results: the command runs each benchmark cycle for approximately 5 seconds while storing CPU, memory, and tracing profiles. Each insertion iteration took approximately 560433ns, completing 35383 cycles (total runtime of ~19 seconds), with 752 allocations and 271014B of memory usage per cycle.
Search operations took only 522404ns per cycle. But does this seem reasonable? Since we’re performing an additional 5,000 insertions, we should investigate whether the trie’s size affects lookup performance.
Testing Fresh vs. Reused Trie
Let’s create a fresh trie instance for the search benchmark to isolate the effects:
func BenchmarkTrieOptimized(b *testing.B) {
	tm := triemap.NewTrieMap()

	b.Run("benchmark insert triemap", func(b *testing.B) {
		sb := strings.Builder{}
		for i := 0; i < b.N; i++ {
			randStr := RandStringBytesMaskImprSrcSB(randRange(5, 500), &sb)

			err := tm.Insert(randStr)
			if err != nil {
				b.Logf("generated string: %s", randStr)
			}
			assert.NoError(b, err)

			sb.Reset()
		}
	})

	tm = triemap.NewTrieMap()
	randStrsTrie := make([]string, 0, 5000)
	sb := strings.Builder{}

	for i := 0; i < 5000; i++ {
		randStrsTrie = append(randStrsTrie, RandStringBytesMaskImprSrcSB(randRange(50, 500), &sb))
		tm.Insert(randStrsTrie[i])
		sb.Reset()
	}

	b.Run("benchmark search triemap", func(b *testing.B) {
		for i := range b.N {
			ok := tm.Search(randStrsTrie[i%len(randStrsTrie)])
			if !ok {
				b.Log("failed seach for: ", randStrsTrie[i])
			}
			assert.True(b, ok)
		}
	})
}
The results with a fresh trie instance show a fascinating difference:
goos: linux
goarch: amd64
pkg: github.com/zero-shubham/data-structures/Trie/trie_map
cpu: AMD Ryzen 7 5800HS with Radeon Graphics
BenchmarkTrieReuseOverload/benchmark_insert_triemap-16         	   35383	    560433 ns/op	  271014 B/op	     747 allocs/op
BenchmarkTrieReuseOverload/benchmark_search_triemap-16         	   97314	     52240 ns/op	       0 B/op	       0 allocs/op
BenchmarkTrieOptimized/benchmark_insert_triemap-16             	   16711	    438244 ns/op	  272505 B/op	     751 allocs/op
BenchmarkTrieOptimized/benchmark_search_triemap-16             	  176598	     31537 ns/op	       1 B/op	       0 allocs/op
PASS
ok  	github.com/zero-shubham/data-structures/Trie/trie_map	117.523s
Note: The variance in insertion performance doesn't show a consistent trend across multiple runs.
Intriguing! We achieved approximately 20703ns improvement in search performance. But why? Let's dive into the profiling data.
Profiling Analysis
Run the profiling visualization tool:
go tool pprof -http=localhost:8080 cpu.out
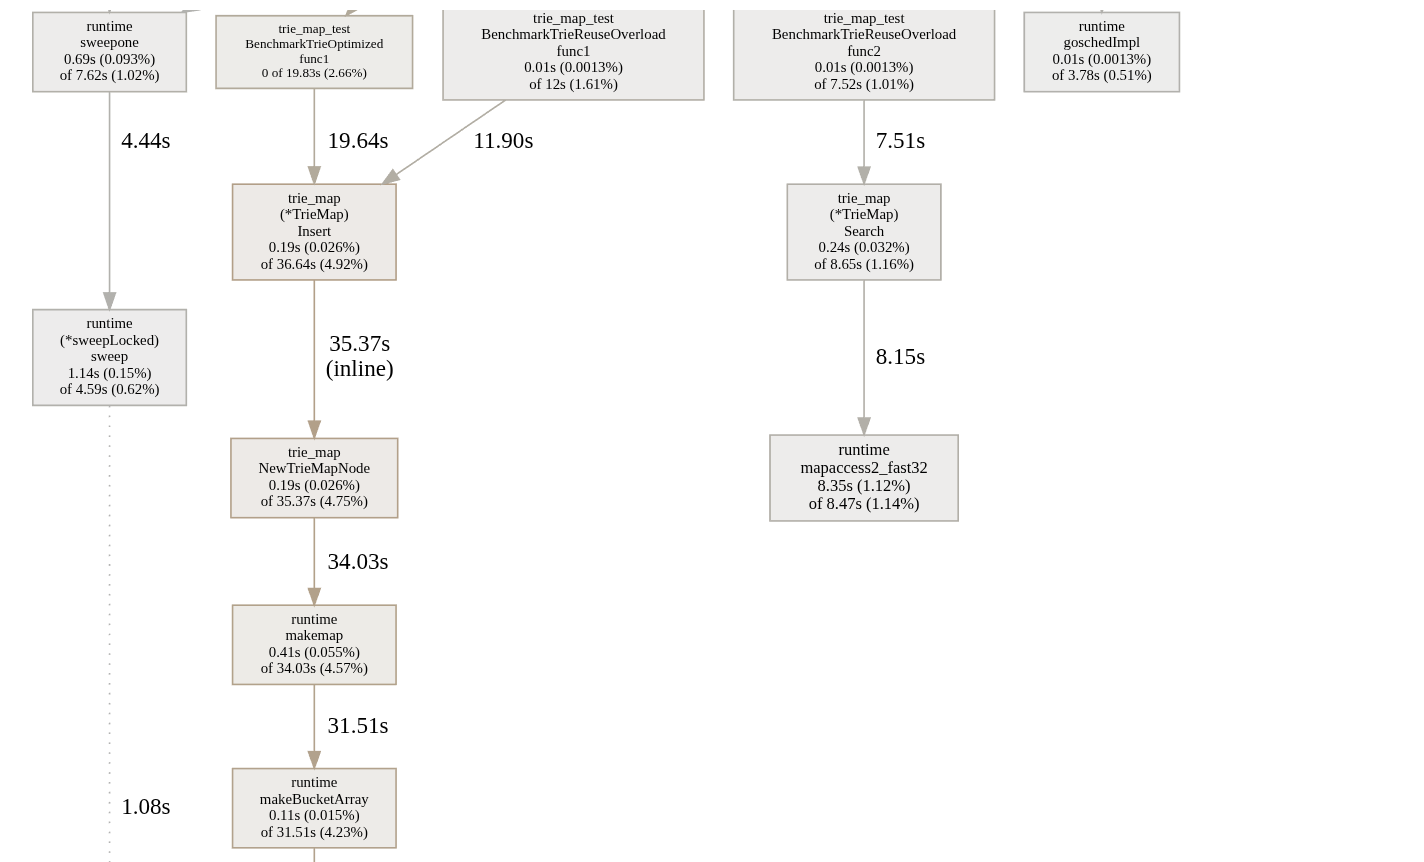
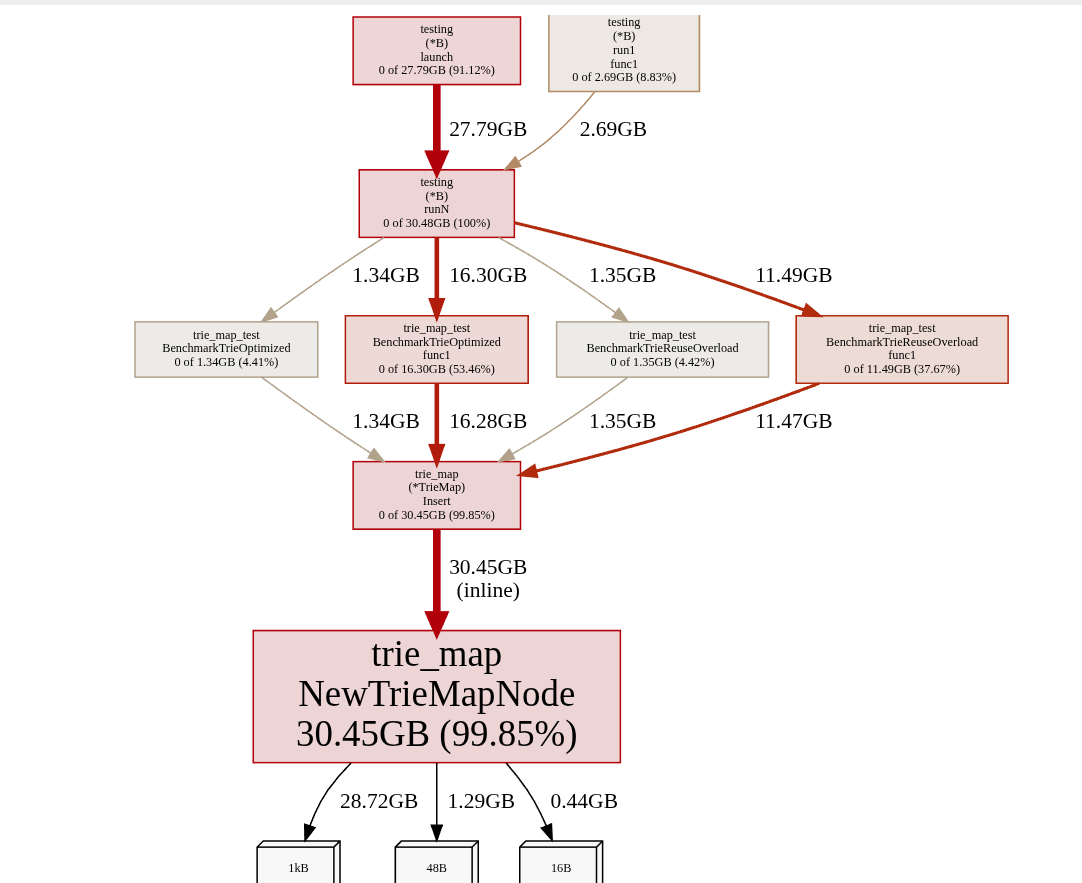
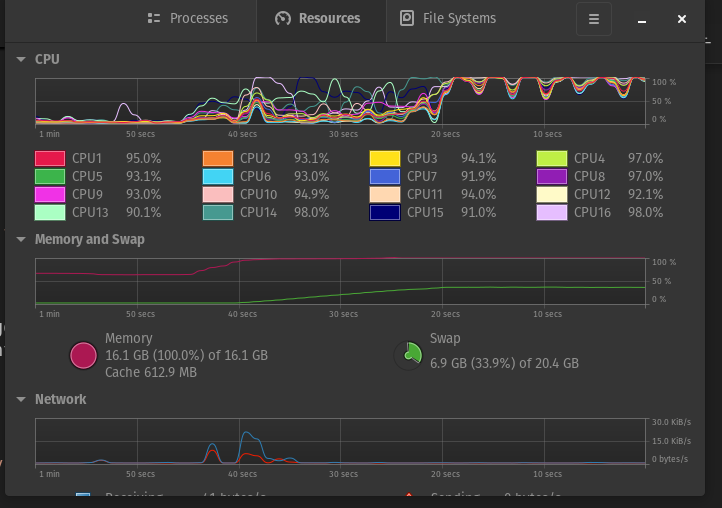
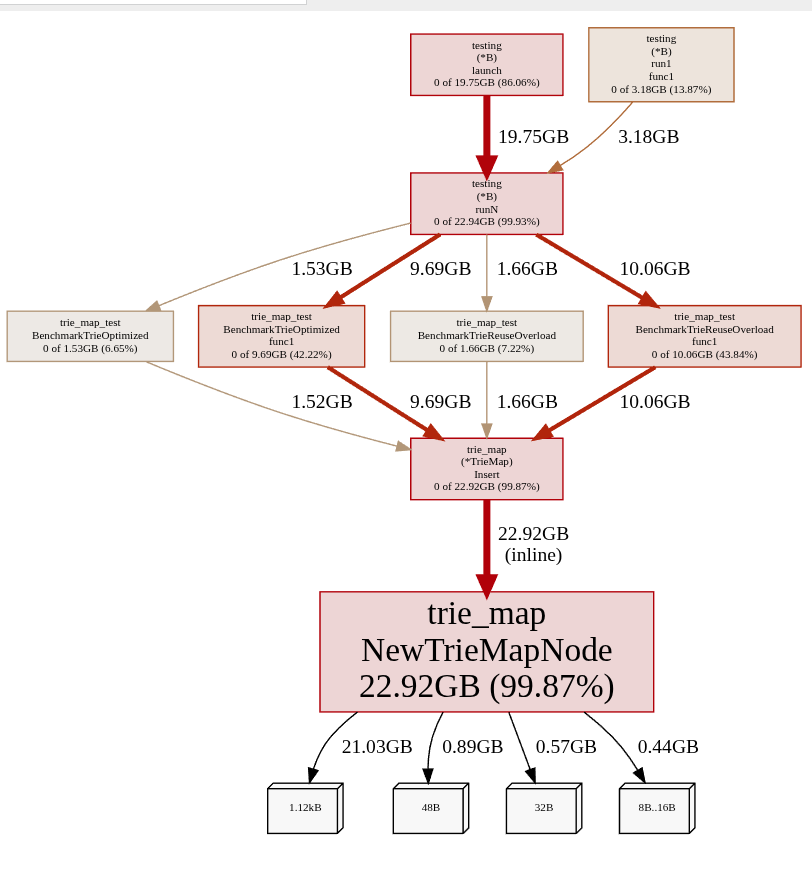
The CPU profile reveals that maps use arrays under the hood (array buckets), and allocating these consumes most of the time during insertion. For search operations, most time is spent on mapaccess2_fast32. The memory profile shows a staggering ~10GB memory usage per benchmark. When we reuse the same trie instance for search, swap memory becomes a factor (my system has 16GB RAM), significantly slowing operations.
Go 1.24’s Swiss Table Implementation
Go 1.24 introduces Swiss table implementation for maps instead of array buckets. Let’s test its performance promises—the best part is that it requires no code changes, just running the same benchmarks with Go 1.24.
goos: linux
goarch: amd64
pkg: github.com/zero-shubham/data-structures/Trie/trie_map
cpu: AMD Ryzen 7 5800HS with Radeon Graphics
BenchmarkTrieReuseOverload/benchmark_insert_triemap-16         	   24322	    421860 ns/op	  313264 B/op	    1247 allocs/op
BenchmarkTrieReuseOverload/benchmark_search_triemap-16         	  116526	     47235 ns/op	       0 B/op	       0 allocs/op
BenchmarkTrieOptimized/benchmark_insert_triemap-16             	   14914	    346134 ns/op	  309331 B/op	    1231 allocs/op
BenchmarkTrieOptimized/benchmark_search_triemap-16             	  165766	     32774 ns/op	       0 B/op	       0 allocs/op
PASS
ok  	github.com/zero-shubham/data-structures/Trie/trie_map	110.838s
We observe increased allocations and memory usage per operation, with slight insertion improvements while search performance remains nearly identical. However, overall memory usage stays lower with Swiss tables, as shown in the memory profile.
Why this apparent contradiction? The Swiss table implementation allows maps to shrink after garbage collection—a major advantage. Previously, with bucket arrays, deleting all keys from a map didn’t guarantee that all memory would be available in the heap for reallocation after garbage collection.
Garbage Collection Impact
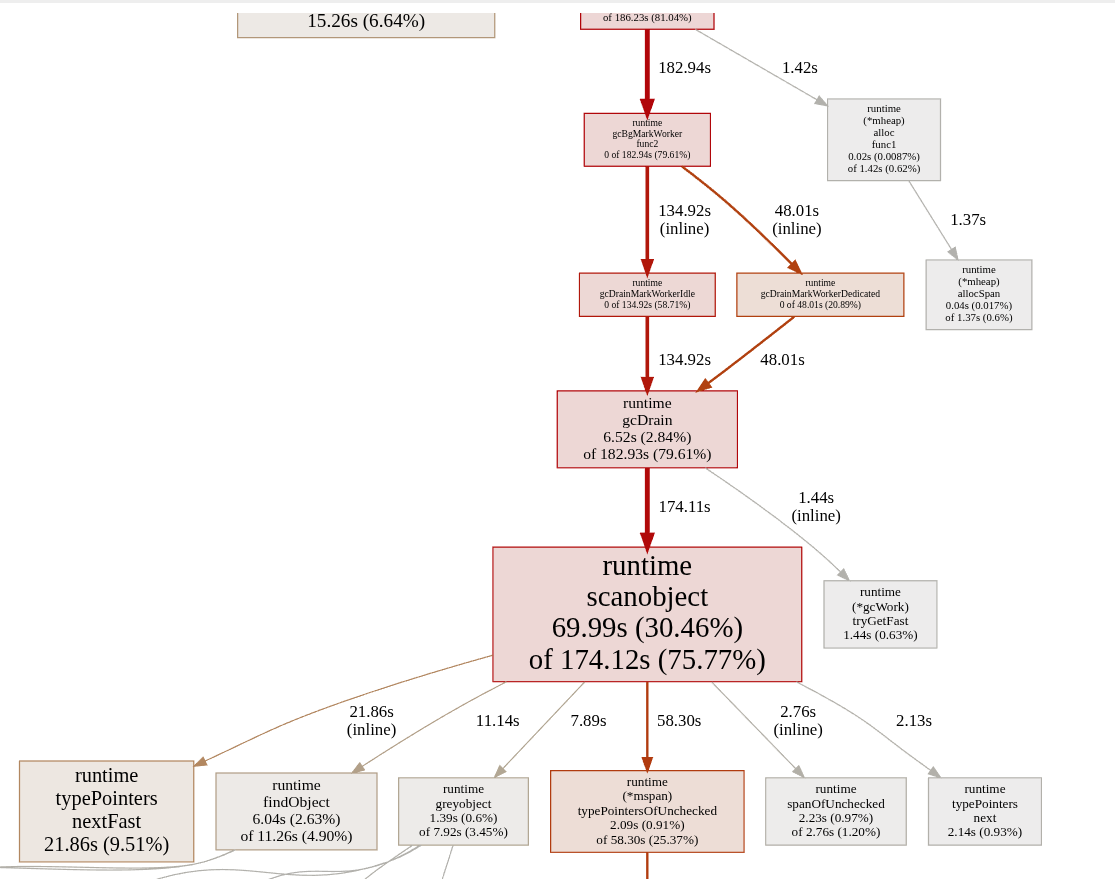
Let’s examine time spent in garbage collection, which also explains why total benchmark iterations and timing accuracy can be misleading:
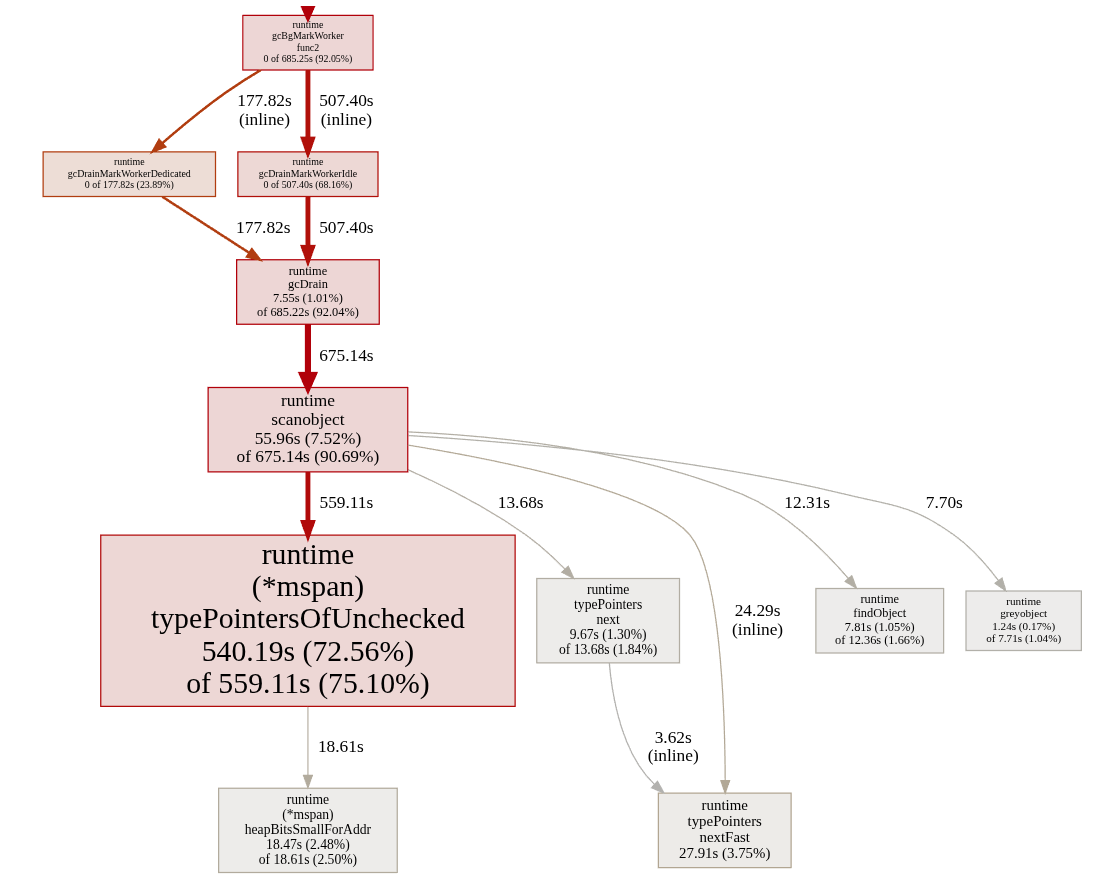
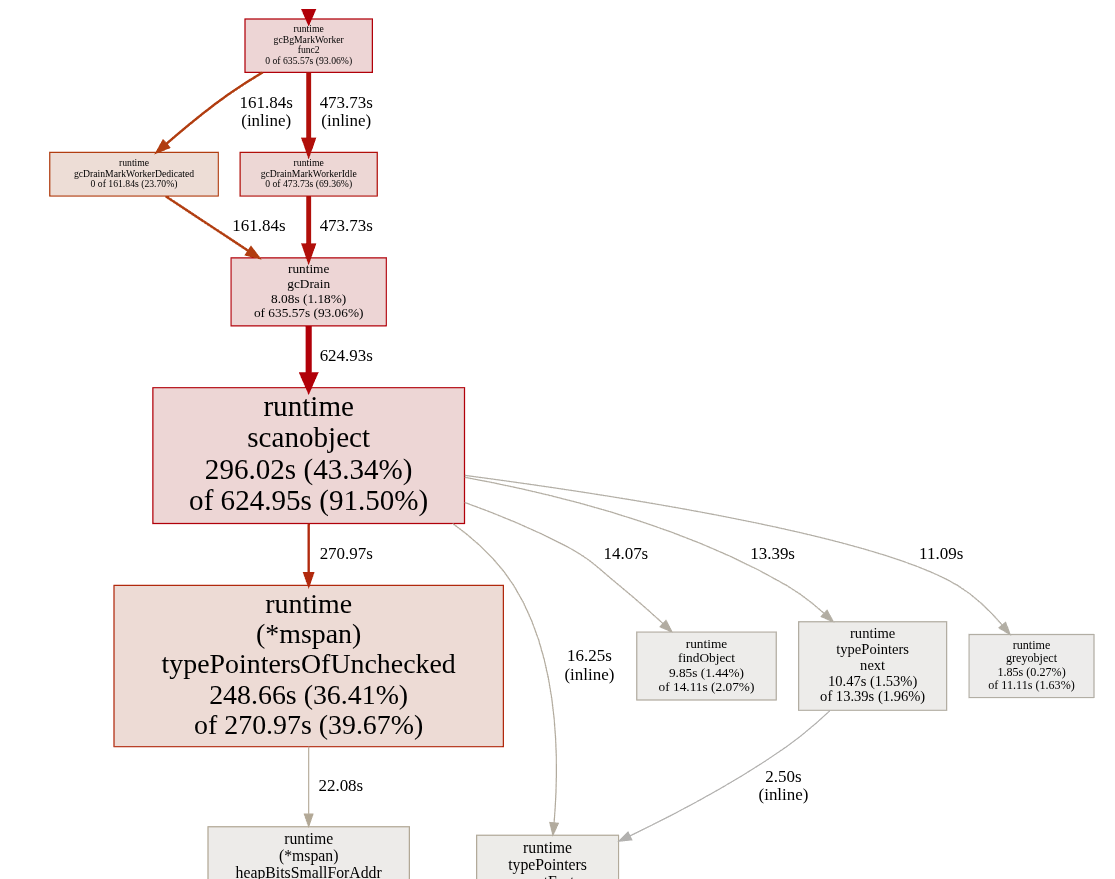
As evident, significant time is spent in garbage collection due to how maps are implemented. During GC's mark and sweep phases, considerable time is consumed.
The Array-Based Optimization
Can we do better? Let’s step back. According to our profiling data, the bottleneck isn’t our code but Go’s map implementation. Arrays offer contiguous memory, simplicity, and minimal overhead. Maps are more efficient than array lookups only when we don’t know the data’s location and must walk through the array.
Can we use arrays in this scenario? Theoretically, it should result in a more efficient program with no extra overhead from underlying data structures. Let’s find out!
package trie

import (
	"fmt"
	"strings"
)

type TrieNode struct {
	word     bool
	children []*TrieNode
}

func NewTrieNode() *TrieNode {
	return &TrieNode{
		word:     false,
		children: make([]*TrieNode, 36),
	}
}

type Trie struct {
	root *TrieNode
}

func NewTrie() *Trie {
	return &Trie{
		root: NewTrieNode(),
	}
}

func isUnsupportedChar(charInt int) bool {
	return (charInt > 57 && charInt < 97) || charInt > 122 || charInt < 48
}

func getIdxPos(charInt int) int {

	if charInt >= 48 && charInt <= 57 {
		return charInt - 48
	}

	// if charInt >= 97 && charInt <= 122 {
	// 	return charInt - 87
	// }

	return charInt - 87
}

func (t *Trie) Insert(word string) error {
	word = strings.ToLower(word)
	curr := t.root
	for _, char := range word {

		charInt := int(char)

		if isUnsupportedChar(charInt) {
			return fmt.Errorf("unsupported character %c", char)
		}

		idxPos := getIdxPos(charInt)

		if curr.children[idxPos] == nil {
			curr.children[idxPos] = NewTrieNode()
		}

		curr = curr.children[idxPos]
	}

	curr.word = true

	return nil
}

func (t *Trie) Search(word string) bool {
	word = strings.ToLower(word)
	curr := t.root

	for _, char := range word {
		charInt := int(char)

		if isUnsupportedChar(charInt) {
			return false
		}

		idxPos := getIdxPos(charInt)

		if curr.children[idxPos] == nil {
			return false
		}

		curr = curr.children[idxPos]
	}

	return curr.word
}
Instead of using maps, we're now mapping runes (characters) to array indices—a simple solution that addresses our performance bottleneck.

Dramatic Performance Improvements
The same benchmarks now deliver considerably better results:
goos: linux
goarch: amd64
pkg: github.com/zero-shubham/data-structures/Trie/trie
cpu: AMD Ryzen 7 5800HS with Radeon Graphics
BenchmarkTrieReuseOverload/benchmark_insert_trie-16         	   88882	     72694 ns/op	   80126 B/op	     500 allocs/op
BenchmarkTrieReuseOverload/benchmark_search_trie-16         	  227923	     26170 ns/op	       0 B/op	       0 allocs/op
BenchmarkTrieOptimized/benchmark_insert_trie-16             	  165526	    129560 ns/op	   79959 B/op	     499 allocs/op
BenchmarkTrieOptimized/benchmark_search_trie-16             	  230310	     26265 ns/op	       0 B/op	       0 allocs/op
PASS
ok  	github.com/zero-shubham/data-structures/Trie/trie	59.755s
We achieved a substantial performance boost — approximately 60 seconds to complete the entire benchmark suite. The improvements stem from fewer required allocations, reduced memory usage per iteration, and significantly less time spent in garbage collection. Arrays provide contiguous memory with no internal hashing or updating overhead, so the memory remains alive as long as the trie instance exists. Search operations also benefit from eliminated runtime overhead when accessing memory.
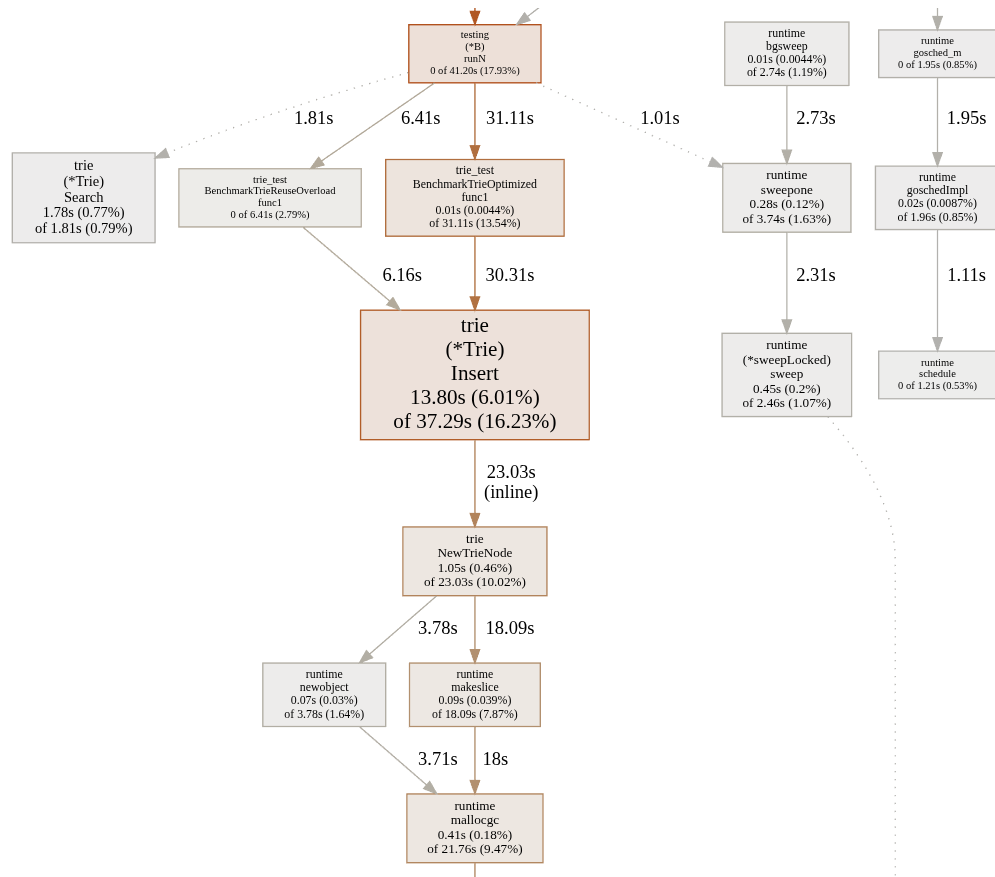
We now have significantly more efficient software, and this optimization journey was entirely worthwhile—thanks to the art of benchmarking and profiling! By systematically measuring performance, identifying bottlenecks through profiling, and making data-driven optimizations, we transformed our trie implementation from a memory-intensive, GC-heavy solution to a lean, high-performance data structure.
Link to repo containing all code used.